The Digital Agency for International Development
Work
- Who we work with
-
All projects
- 3ie Impact - Website
- ATA - Intranet
- ATA Nigeria - M&E
- AuthorAID – User experience review
- BEAM Exchange - Website
- Bond - Impact Builder
- Camfed - Mobile data collection field kits for Monitoring and Evaluation
- CBM & Mobility India - Mobile data collection
- CDKN - Website information architecture and microsite
- Coral Reef Rescue - Knowledge Hub
- e-immigrate - Event registration and analysis system
- eConsensus - Participatory decision making
- Forced Migration Online - Digital Library
- Future Fit - Funding eligibility checker
- INASP - Branding and responsive website
- INASP - How to Accelerate Your Internet
- INASP - Web Design Guidelines
- Internews - Humanitarian Information Dashboard
- Intrac - M&E Universe
- IPPF - mHealth discovery process
- iSchool - eLearning package
- Kashana – Web Based Monitoring Evaluation & Learning
- KENET - Network and Bandwidth Management Training
- Knowledge Point – User experience redesign.
- LEDS GP - Website clone with interactive map
- Loband - Low bandwidth simulator
- MapAction - Map and data repository and marketing website
- OSF - Point
- ParEvo - Web Application
- pmGraph - Network monitoring tool
- Practical Action - Flood solutions catalogue
- Pradan - MEL dashboard discovery
- PreventionWeb - Evaluation
- RUFORUM - Grants management
- Tegemeo Institute – MLE Study
- TradeMapper – Interactive Map
- UN (WHO/FAO/UNEP/WIPO) - Research4Life
- Unicef Zambia - Participatory mobile data collection
- V4C - Log frame monitoring system
- WASHwatch - Website
- WaterAid - Interactive map
- World Bank – Evaluation Framework for Digital Citizen Engagement
- YouWiN! – Enterprise-development grant platform
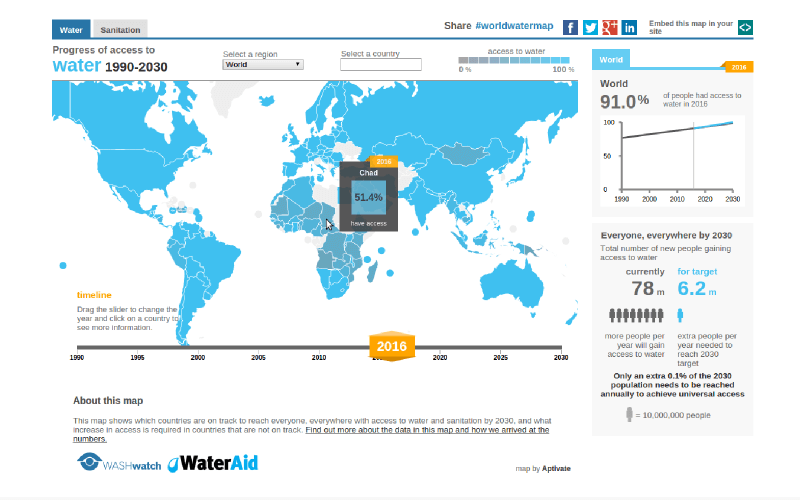
WaterAid - Interactive map
A responsive, interactive map for international water charity WaterAid showing the worlds access to water and sanitation from 1990 to 2030
Apr 2014 to May 2014

